
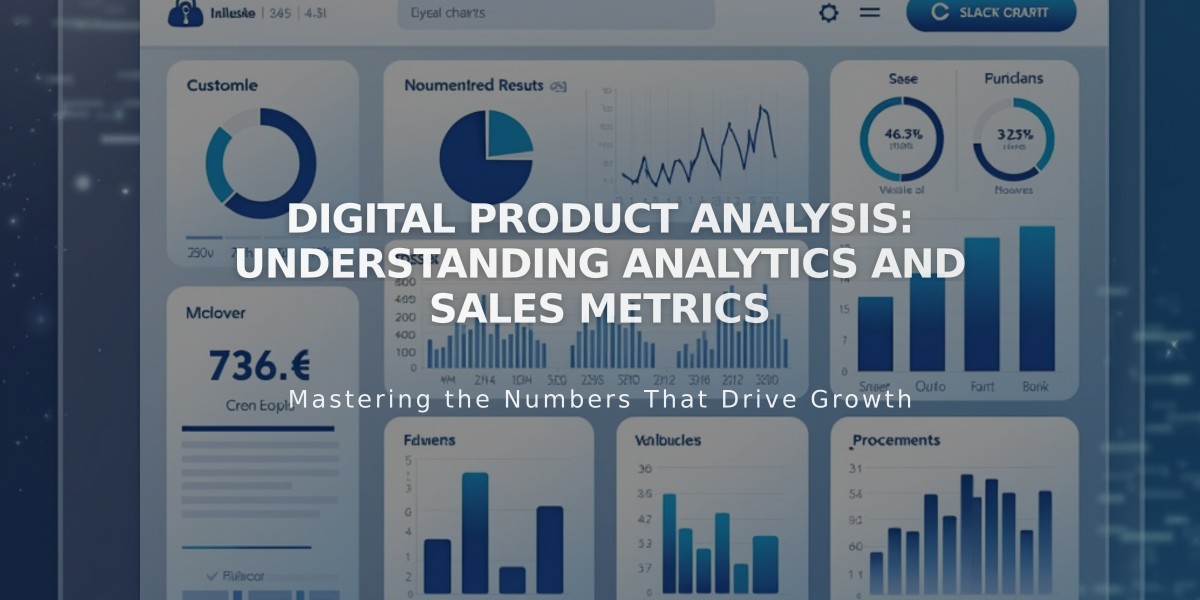
Digital Product Analysis: Understanding Analytics and Sales Metrics
The Analytics Dashboard provides crucial insights into how customers interact with your digital products and packages.
Package Analytics Overview Monitor package performance through analytics data to understand customer behavior and sales trends. Note that free packages aren't included in sales analytics or conversion metrics since they bypass the payment process.
Key Analytics Panels
Sales Analysis Track seven essential metrics for package sales:
- Revenue (including recurring and fixed payments)
- Units Sold
- Payments
- Orders
- Conversion Rate
- Average Order Value (AOV)
- Revenue Per Customer (RPC)
Product Sales Breakdown View detailed metrics for each package:
- Revenue from recurring/fixed payments
- Units Sold
- Orders Note: Views and Conversion Rate columns remain empty for packages
Conversion Funnel Metrics Track customer journey through:
- Visits
- Purchase Started
- Purchased
Package subscriptions exclude "Viewed Product" and "Added to Cart" phases. Recurring payments aren't included in funnel analysis.
Traffic Sources Identify which channels drive package subscriptions and generate revenue.
Content Performance Monitor engagement metrics for:
- Blog posts
- Courses
- Videos
- Members-only content
Views are only counted for subscribed users, excluding paywall-restricted content.
This data helps optimize your digital product strategy and improve customer experience while maximizing revenue potential.
Related Articles
Track Your Digital Product Performance: Essential Analytics Guide