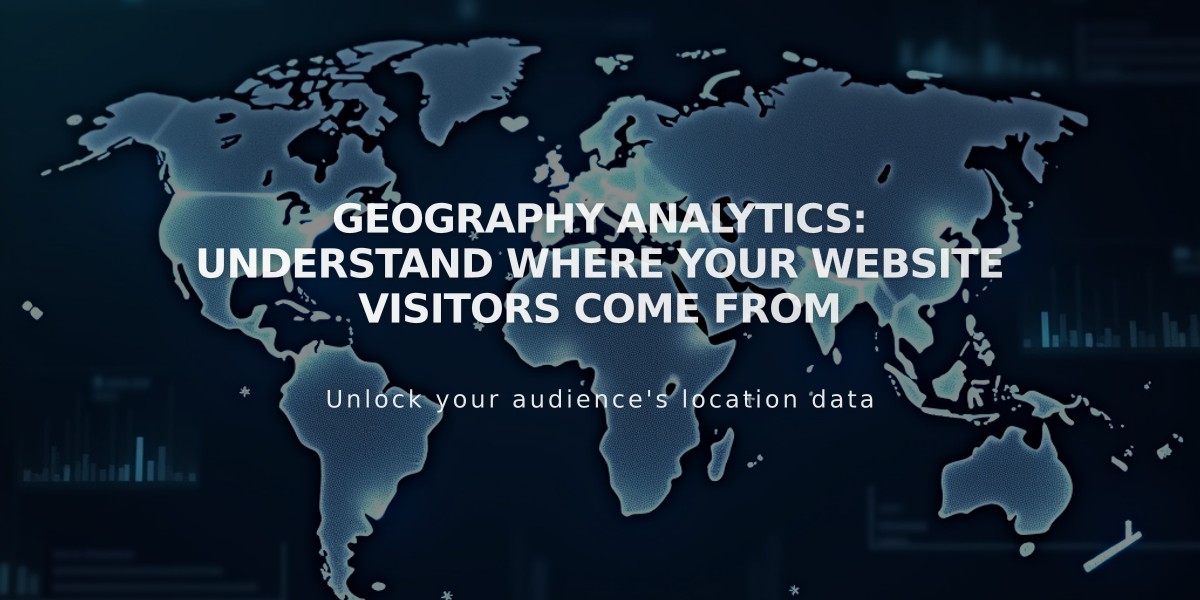
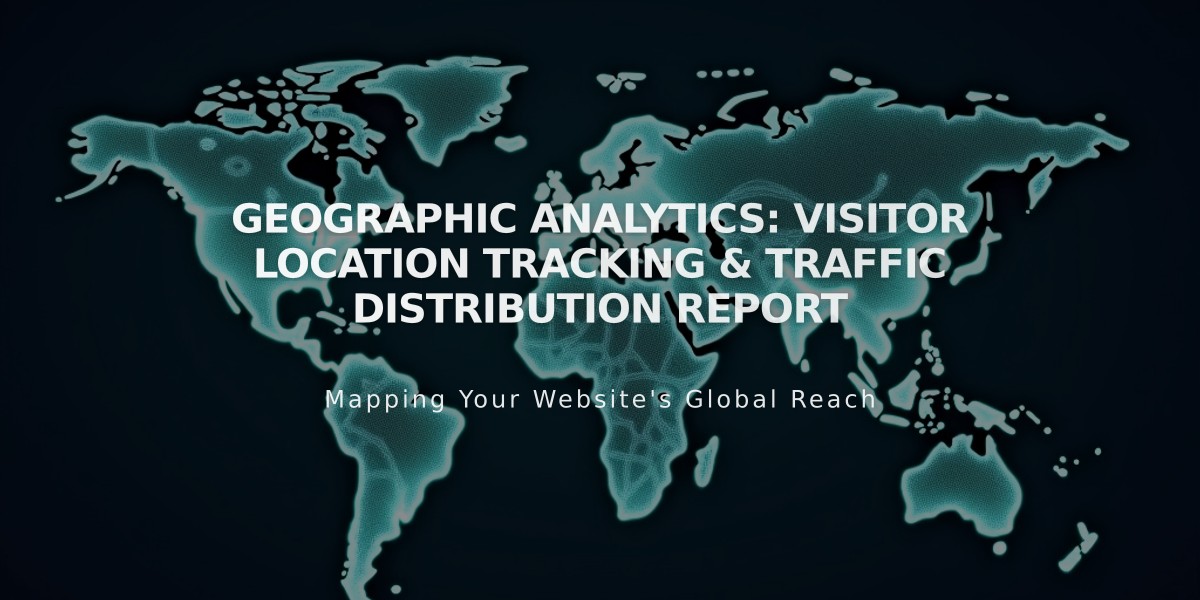
Geographic Analytics: Visitor Location Tracking & Traffic Distribution Report
Geographical statistics in Squarespace Analytics help you understand where your visitors come from, enabling better targeting and marketing decisions.
Map Visualization
The interactive heatmap displays visitor distribution globally, with darker shades indicating higher traffic areas. You can:
- View visits by country, region, and city
- Hover over locations to see exact visitor numbers
- Click areas to zoom in for detailed regional data
- Filter data by custom date ranges from January 2014 onward
Data Table
The table below the map automatically updates as you explore, showing:
- Visitor counts for active locations
- Percentage of total traffic per area
- Detailed breakdowns when clicking specific locations
- Only locations with recorded visits
Mobile App Features
iOS App:
- Interactive heatmap with zoom functionality
- Detailed location data in sortable tables
- Regional and city-level analytics
Android App:
- Bar chart showing top countries
- Comprehensive visit breakdown by location
- Google Maps integration for cities
- Regional and city-specific data available
Data Collection Notes
- Location data is collected through IP addresses
- "Unknown" entries appear when IP location data is unavailable
- Some discrepancies may exist between Squarespace and Google Analytics due to different IP tracking methods
Understanding this geographical data helps optimize regional marketing efforts and track global website reach effectively.
Note: The Geography panel is found under Analytics > Traffic > Geography in your Squarespace dashboard.
Related Articles
Traffic Anomaly Detection & Reporting: Monitor Website Volume Changes