
Traffic Anomaly Detection & Reporting: Monitor Website Volume Changes
Traffic notifications provide insights about significant changes in your website's traffic patterns, helping you monitor performance across different marketing channels. The system uses machine learning to detect anomalies and display them directly in your traffic analytics chart.
How Traffic Anomaly Detection Works
The system uses machine learning to compare current traffic against the past 28 days of data. Significant changes are identified when traffic falls outside 99% of your normal traffic distribution. Your site needs at least 28 days of traffic history for the system to recognize patterns effectively.
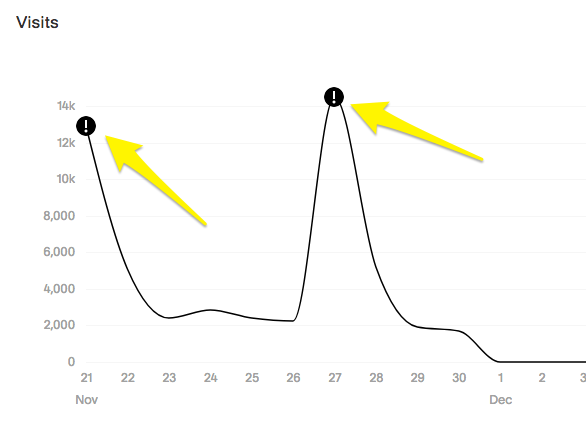
Yellow line chart with metrics
Viewing and Understanding Anomalies
To check traffic anomalies:
- Navigate to Analytics > Traffic
- Select your desired date range
- Click any warning symbols in the chart
Each anomaly report shows:
- Date of occurrence
- Traffic volume during the event
- Affected top pages (up to 2) and their traffic percentage
- Contributing traffic channels
Using Anomaly Data to Improve Traffic
When you identify an anomaly:
- Review which traffic sources contributed to the change
- Analyze the affected pages
- Adjust your marketing strategy accordingly
- Test different approaches to optimize traffic
For example, if you notice decreased Facebook traffic, experiment with different social sharing strategies to determine what works best for your audience.
Providing Feedback
To help improve the anomaly detection system:
- Look for the "Is this helpful?" message at the bottom of anomaly reports
- Click thumbs up or down
- Add optional comments
- Submit your feedback
The system continues to learn and improve as it collects more data and user feedback, providing increasingly accurate and useful traffic insights over time.
Related Articles

Geography Analytics: Understand Where Your Website Visitors Come From