

Traffic Analytics Guide: How to Track & Analyze Website Performance
Measure your site's traffic and engagement with three key performance indicators (KPIs):
Unique Visitors
- Estimates total number of actual visitors
- Tracked via 2-year browser cookie
- Measures loyal audience and readership
- Resets when visitors clear cookies or use different browsers
Visits
- Single browsing sessions that can include multiple pageviews
- Tracked with 30-minute browser cookie
- Sessions end at midnight
- One person can register multiple daily visits
- Indicates attention and engagement
Pageviews
- Total page requests received
- Includes: Not linked pages, collection items, password-protected pages
- Excludes: Image URLs, scripts, 404 pages
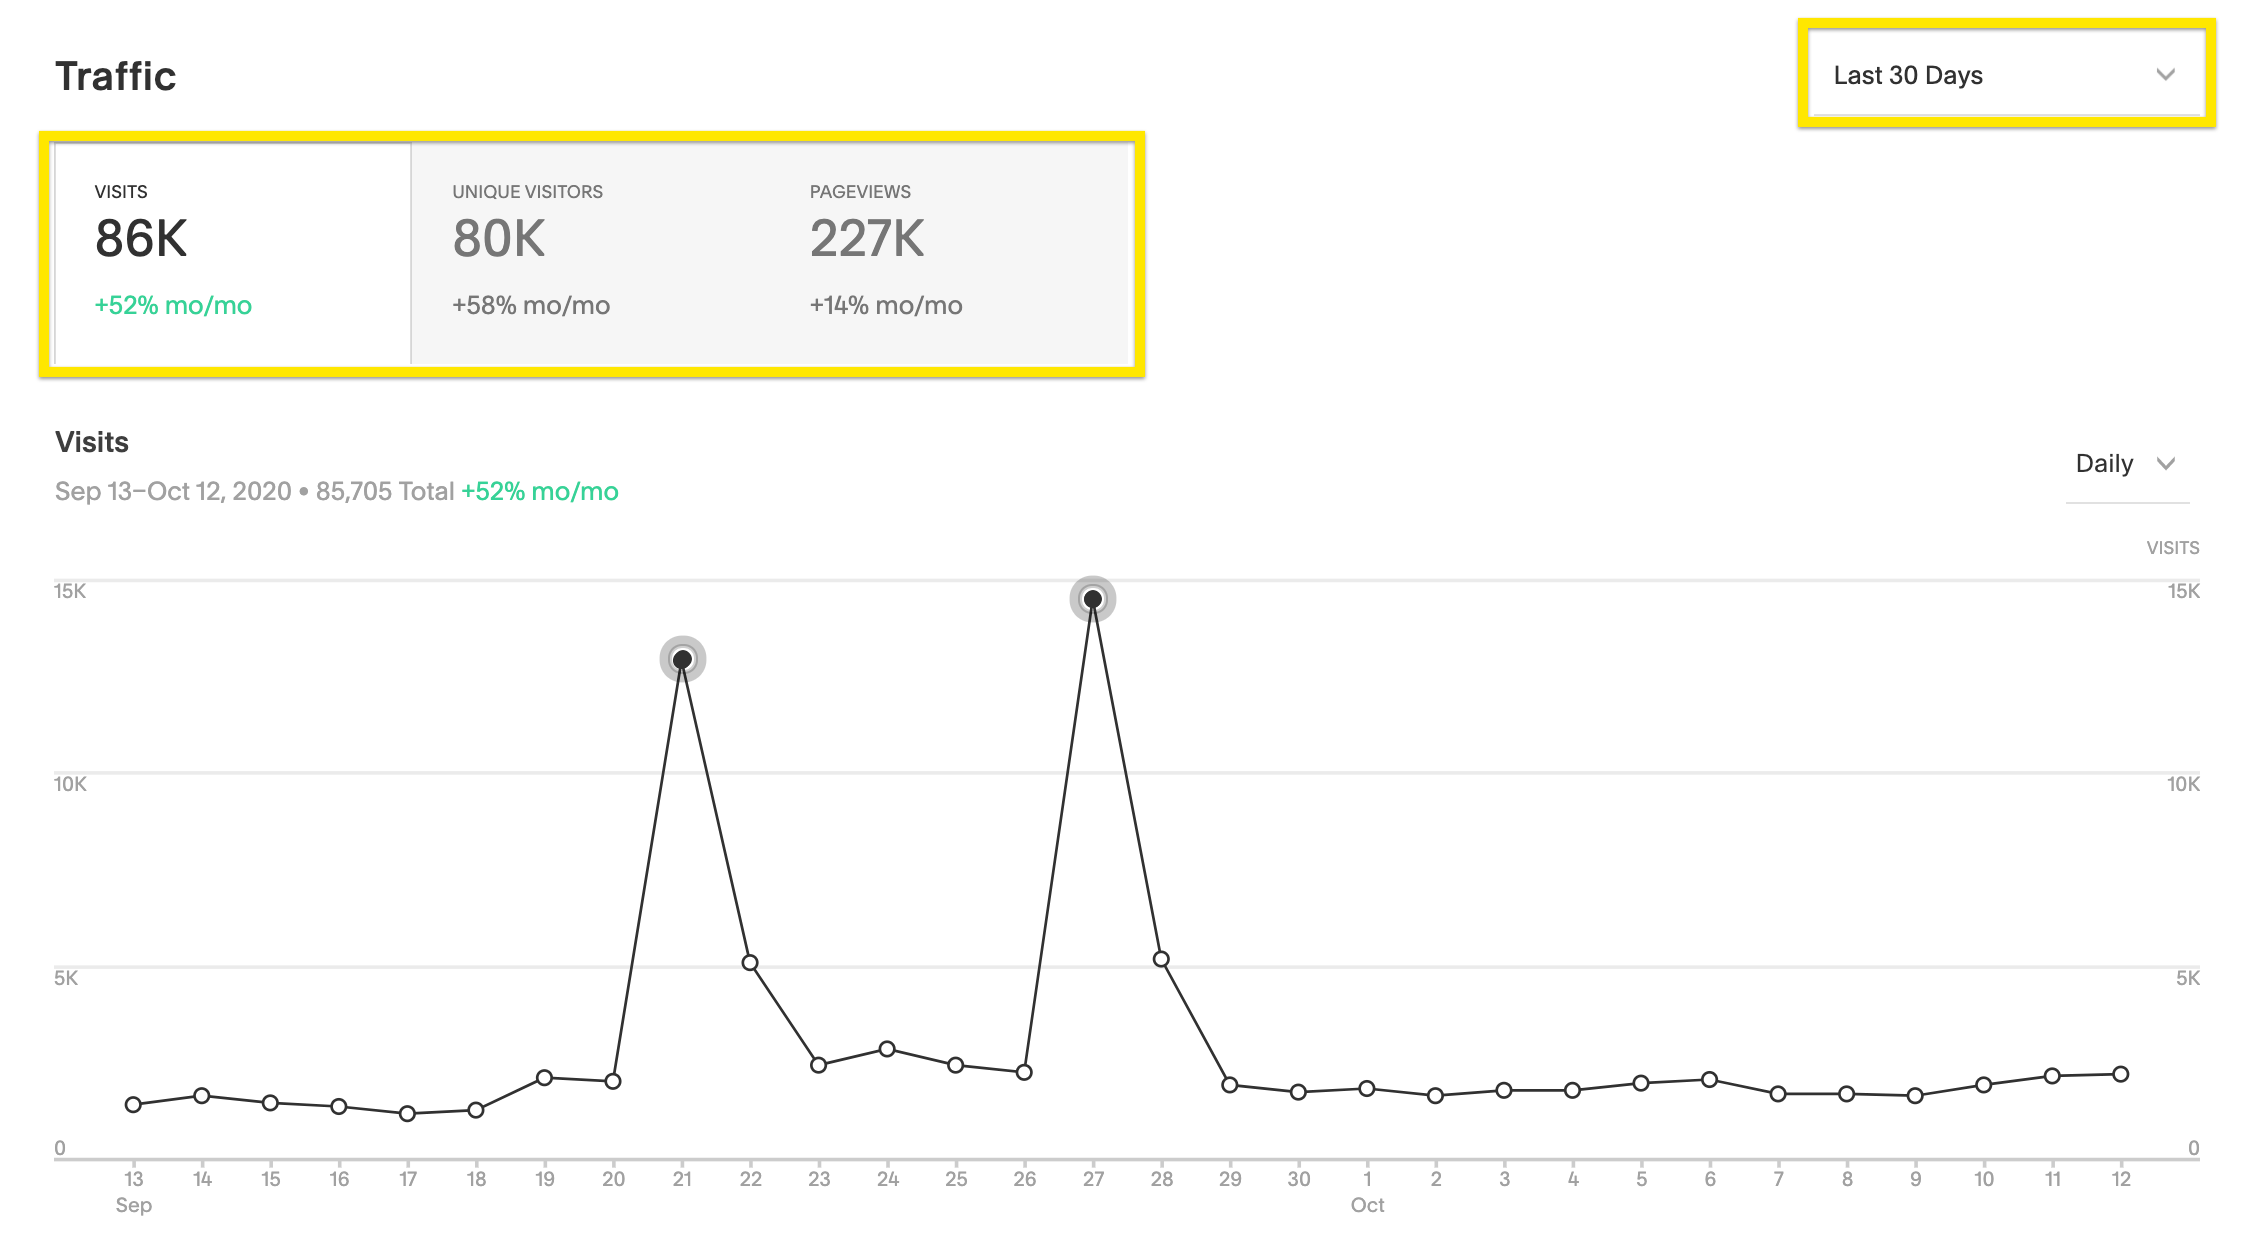
Website traffic analytics line chart
Index Page Views (v7.0)
- Sub-pages accessed from main index count as index page view
- Direct sub-page URL access counts as individual page view
Analytics Dashboard Features
- Date range filtering from January 2014
- Percent change comparisons
- Traffic alerts
- Daily/weekly/monthly view options
- Interactive line graph showing trends
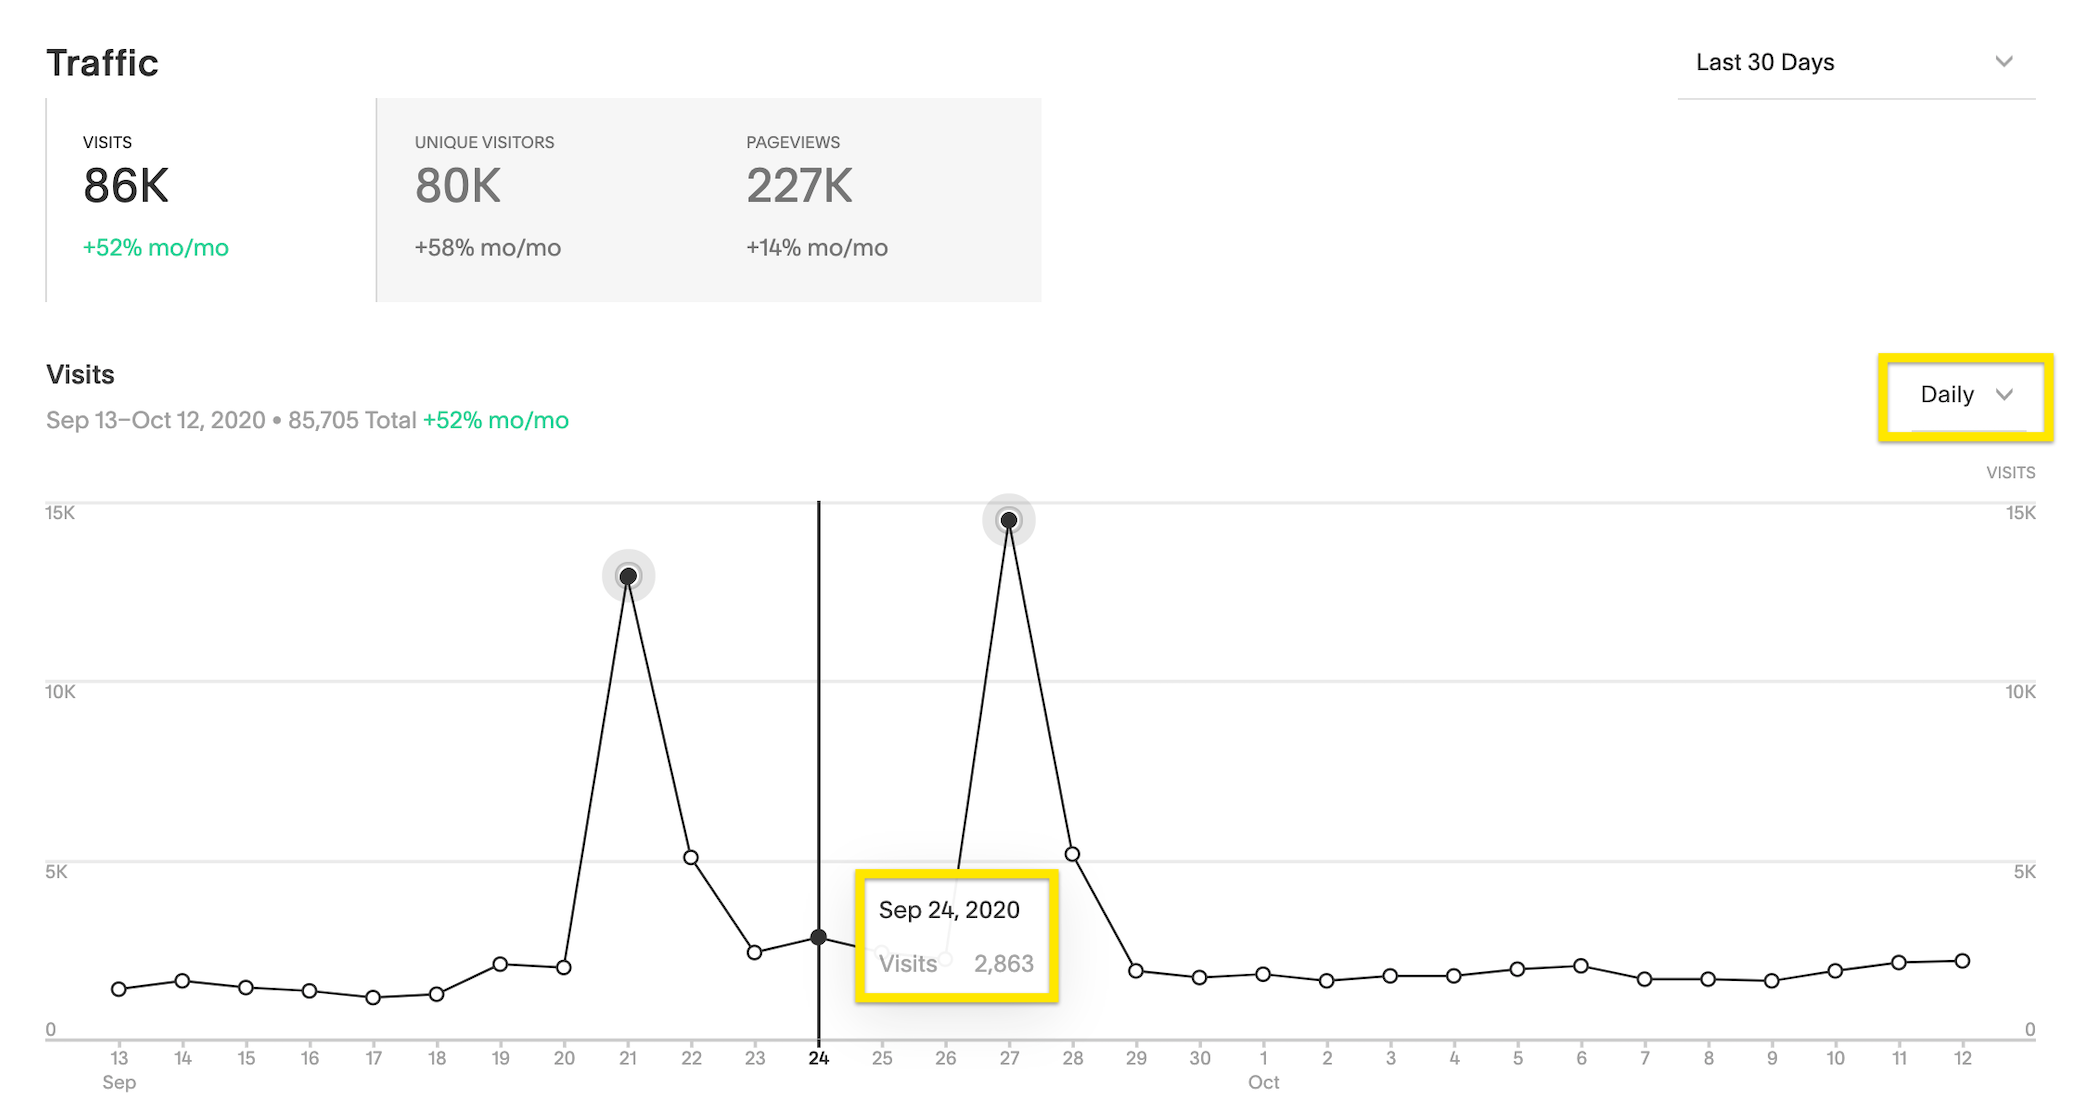
Squarespace Analytics dashboard chart
Additional Data Breakdowns
- Device type (mobile, computer, tablet)
- Traffic sources
- Browser usage
- Operating systems
Note on Chrome's "Do Not Track"
- When enabled, each page view registers as new visitor
- May inflate unique visitors and visit data
- Pageview count remains accurate
Related Articles

Traffic Anomaly Detection & Reporting: Monitor Website Volume Changes