

Traffic Analytics: Understanding Website Visits, Pageviews, and Unique Visitors
Traffic Analysis shows how well your website performs by tracking three key metrics: visits, pageviews, and unique visitors. Here's what each metric means and how to analyze them effectively.
Key Performance Indicators (KPIs):
- Visits: Individual browsing sessions within a 30-minute period
- Pageviews: Total number of page requests on your site
- Unique Visitors: Estimated total number of individual visitors (tracked via 2-year cookie)
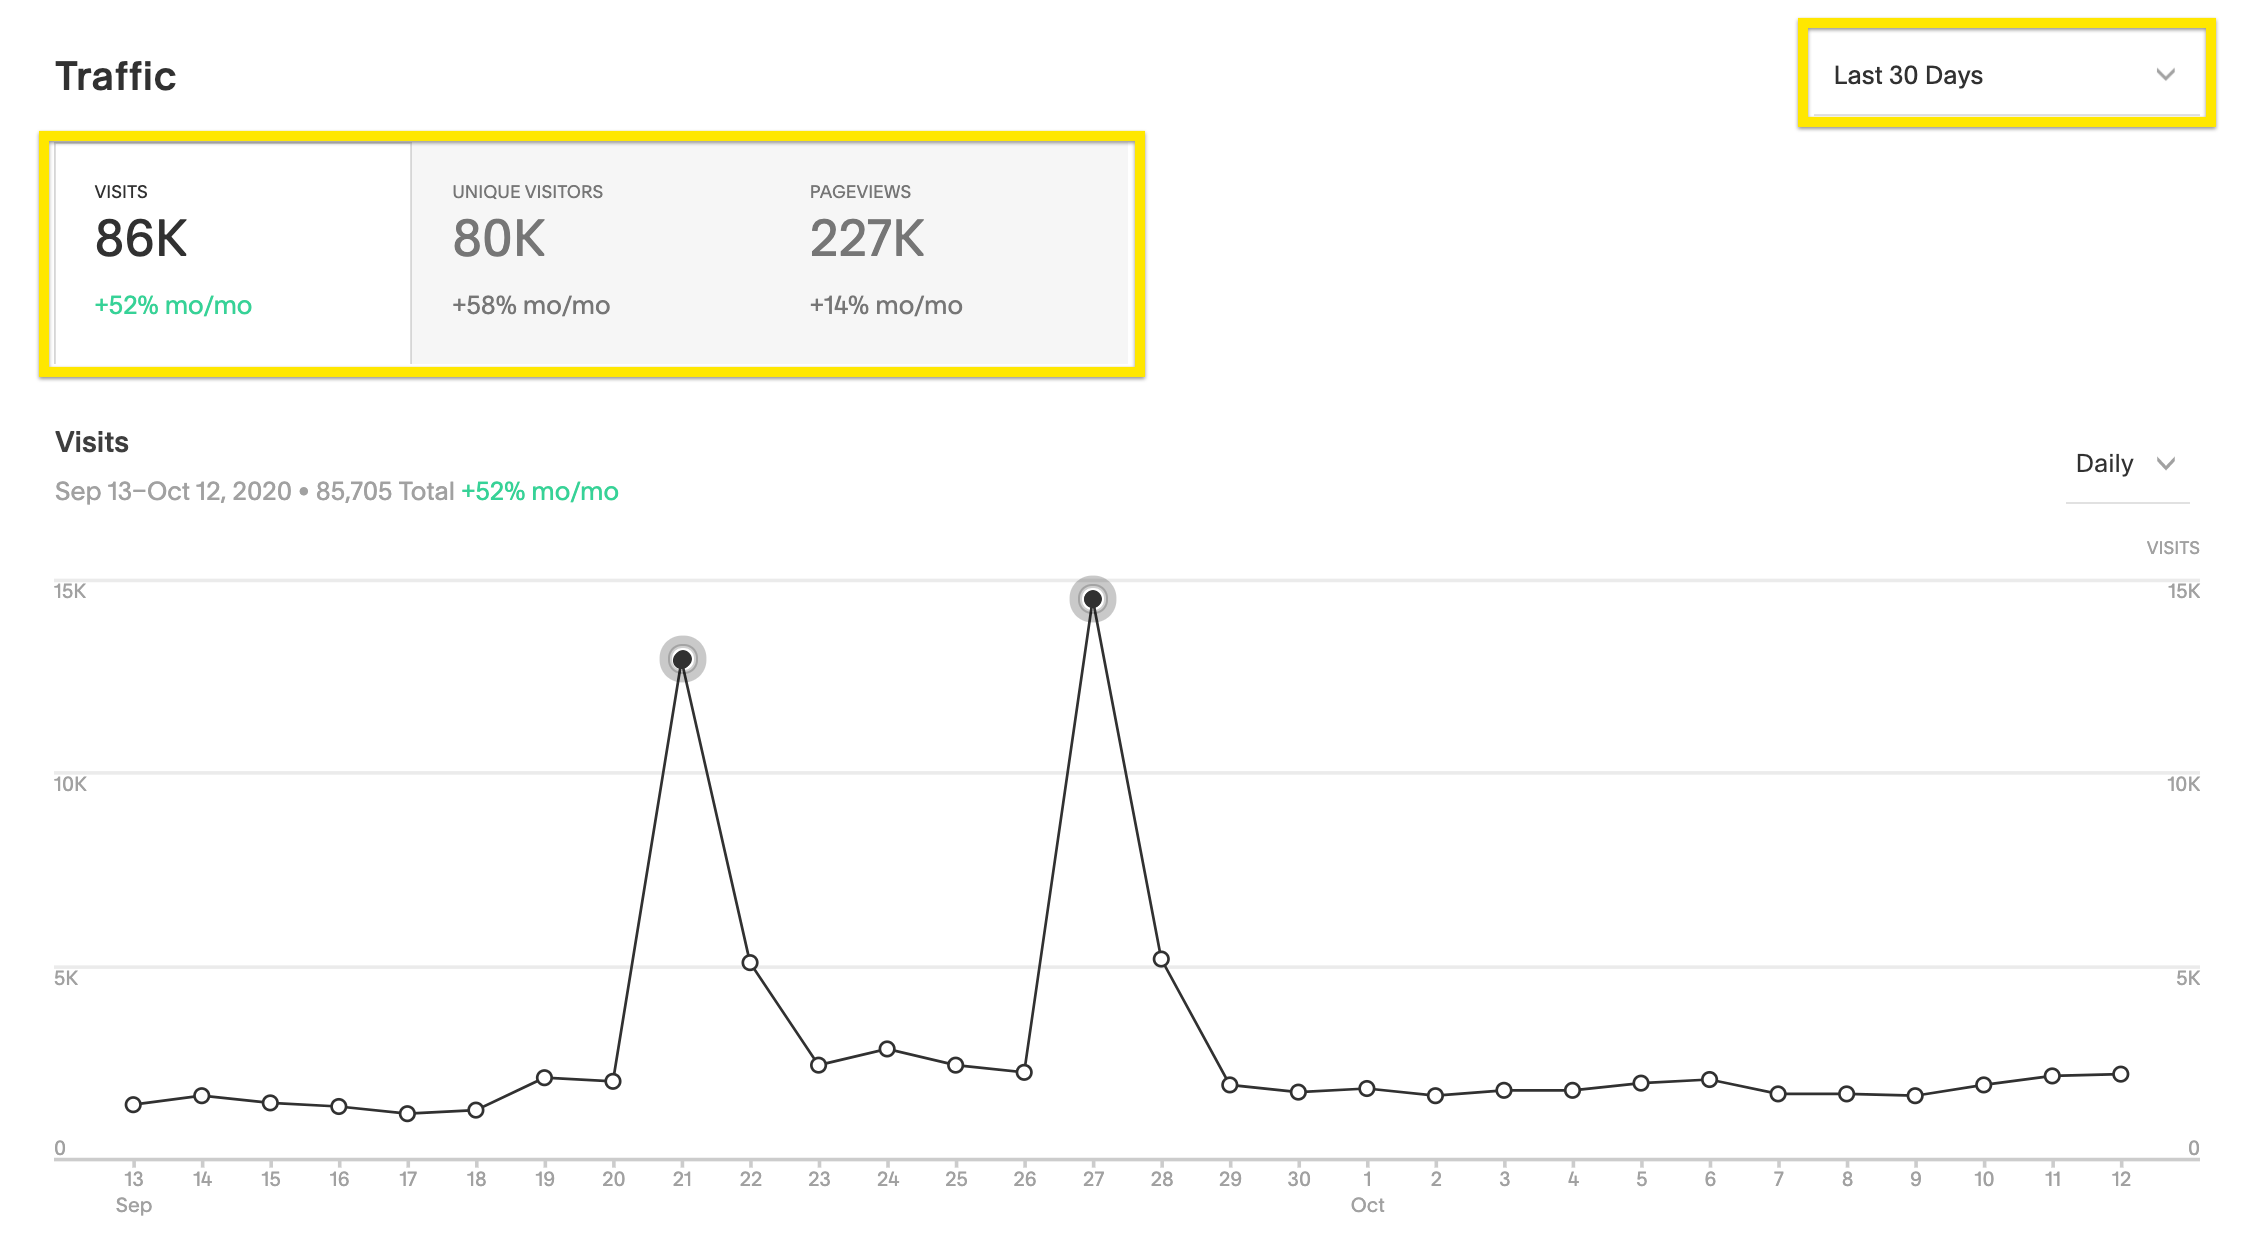
Web traffic line chart
How to Use the Traffic Panel:
- Access Analytics and select Traffic
- Choose your date range (data available from January 2014)
- Select specific KPIs to analyze
- Review traffic alerts marked with ! icons
Understanding Each Metric:
Unique Visitors:
- Measures actual audience size
- Tracked by browser cookies
- Cookie lasts 2 years
- Resets if cookies are deleted or different browser is used
Visits:
- Represents single browsing sessions
- 30-minute cookie duration
- Multiple visits possible per day
- Sessions reset at midnight
- Indicates site engagement level
Pageviews:
- Counts actual page requests
- Includes:
- Fully loaded pages
- Unlinked sections
- Collection items
- Password-protected pages (post-access)
- Excludes image URLs, scripts, and 404 pages
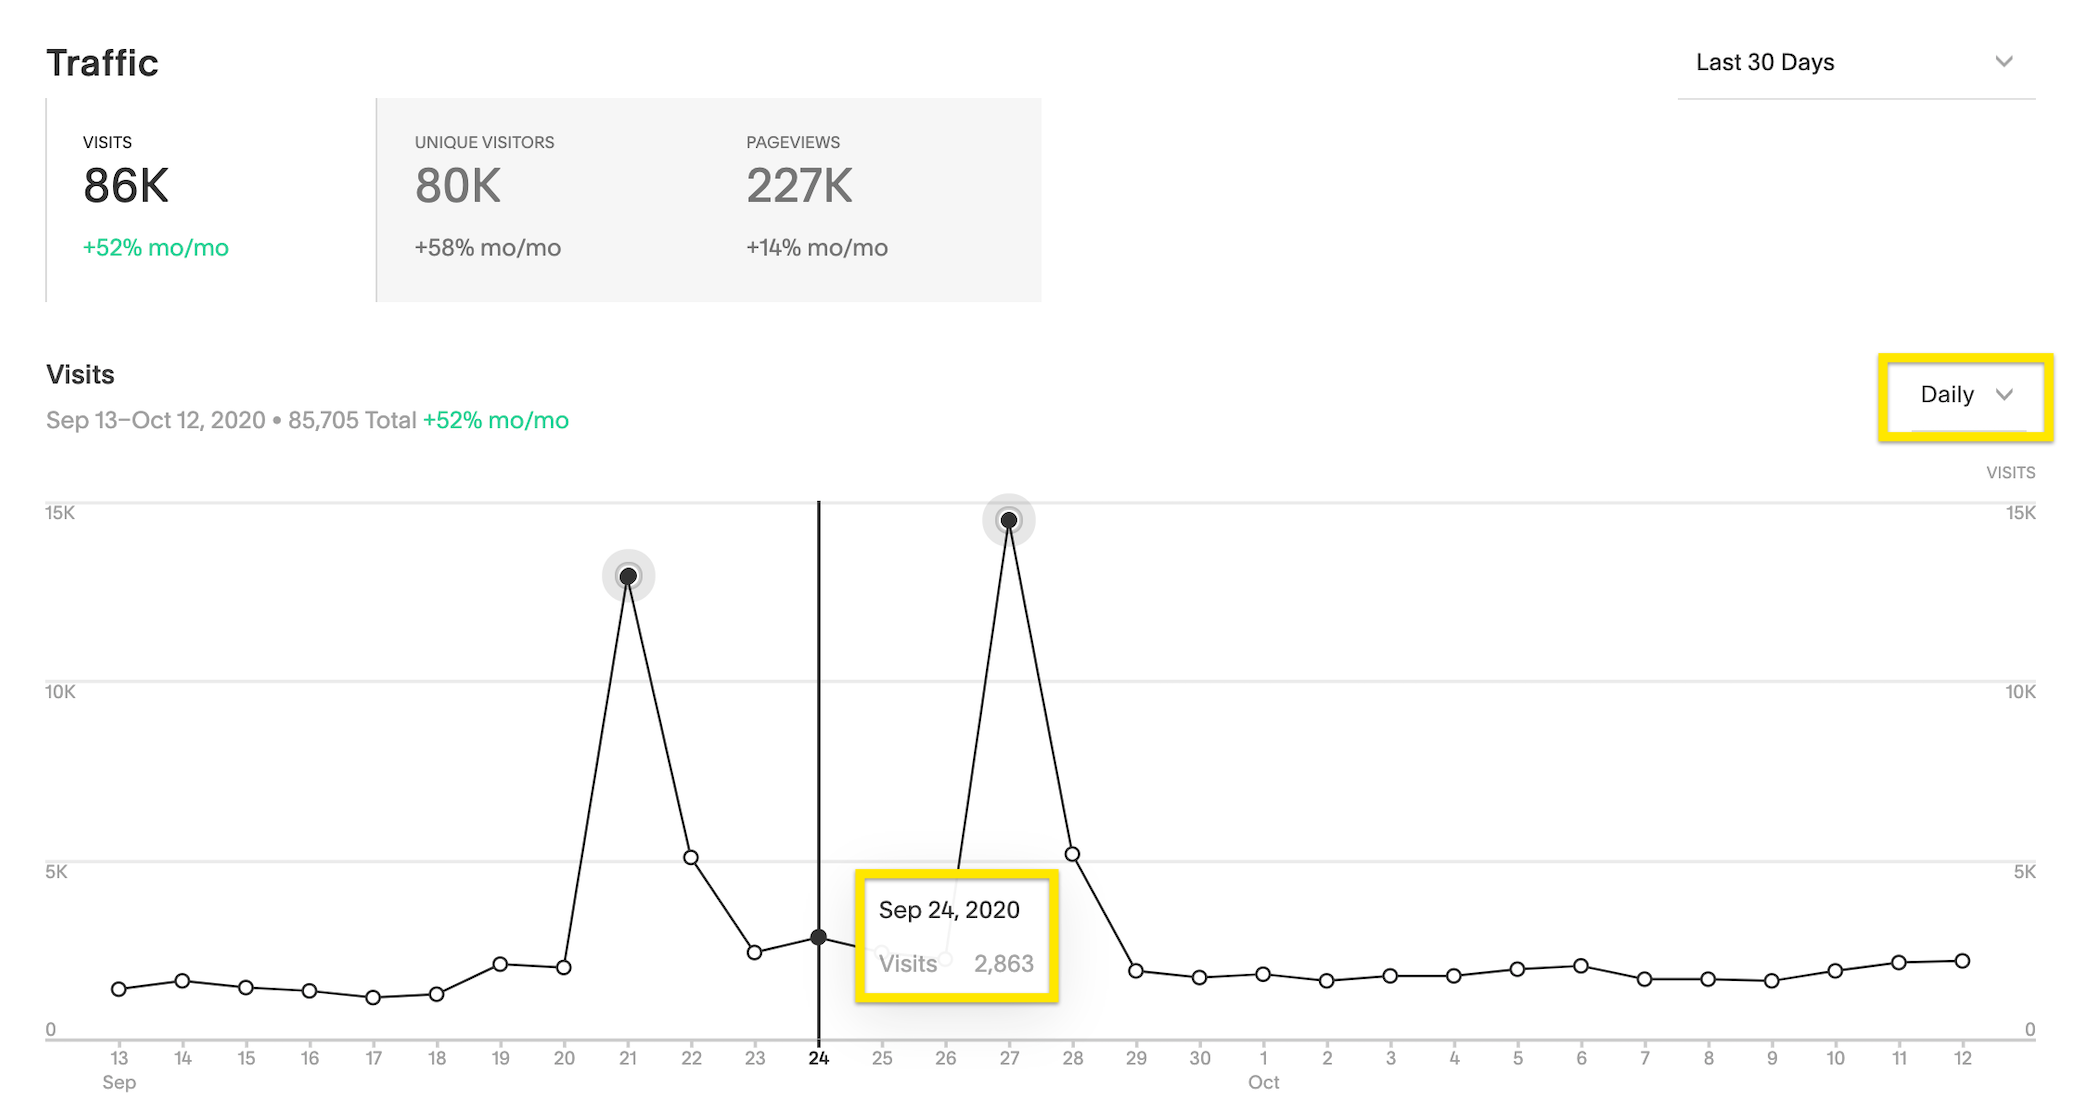
Website traffic graph
Additional Analysis Features:
Bar and Pie Charts (Visits):
- Device type distribution (mobile/computer/tablet)
- Traffic sources
- Browser usage
- Operating system breakdown
Note: Chrome's "Do Not Track" setting may affect analytics accuracy by recording each pageview as a new visitor when enabled.
Index Page Views (7.0):
- Secondary pages via Index: counts toward Index Page
- Direct URL access: counts toward individual page
Related Articles

Traffic Anomaly Detection & Reporting: Monitor Website Volume Changes