

Form and Button Conversion Analytics Panel: A Complete Guide
Form and Button Analytics help you track visitor interactions with your site's interactive elements, measuring views, submissions, clicks, and conversion rates. This data helps optimize your site's performance and improve user engagement.
Conversion Rate Calculation:
- Formula: (Unique Views Converted ÷ Unique Views) x 100
- Example: If a visitor clicks three times in one visit, it counts as one unique view conversion
Tracked Elements:
- Button Block
- Newsletter Block
- Form Block
- Promotional Pop-ups
- Cover Elements
Not Tracked:
- Banner Buttons
- Navigation Buttons
- Social Media Icons
- Donation Forms
- Payment Forms
- Image Block Buttons
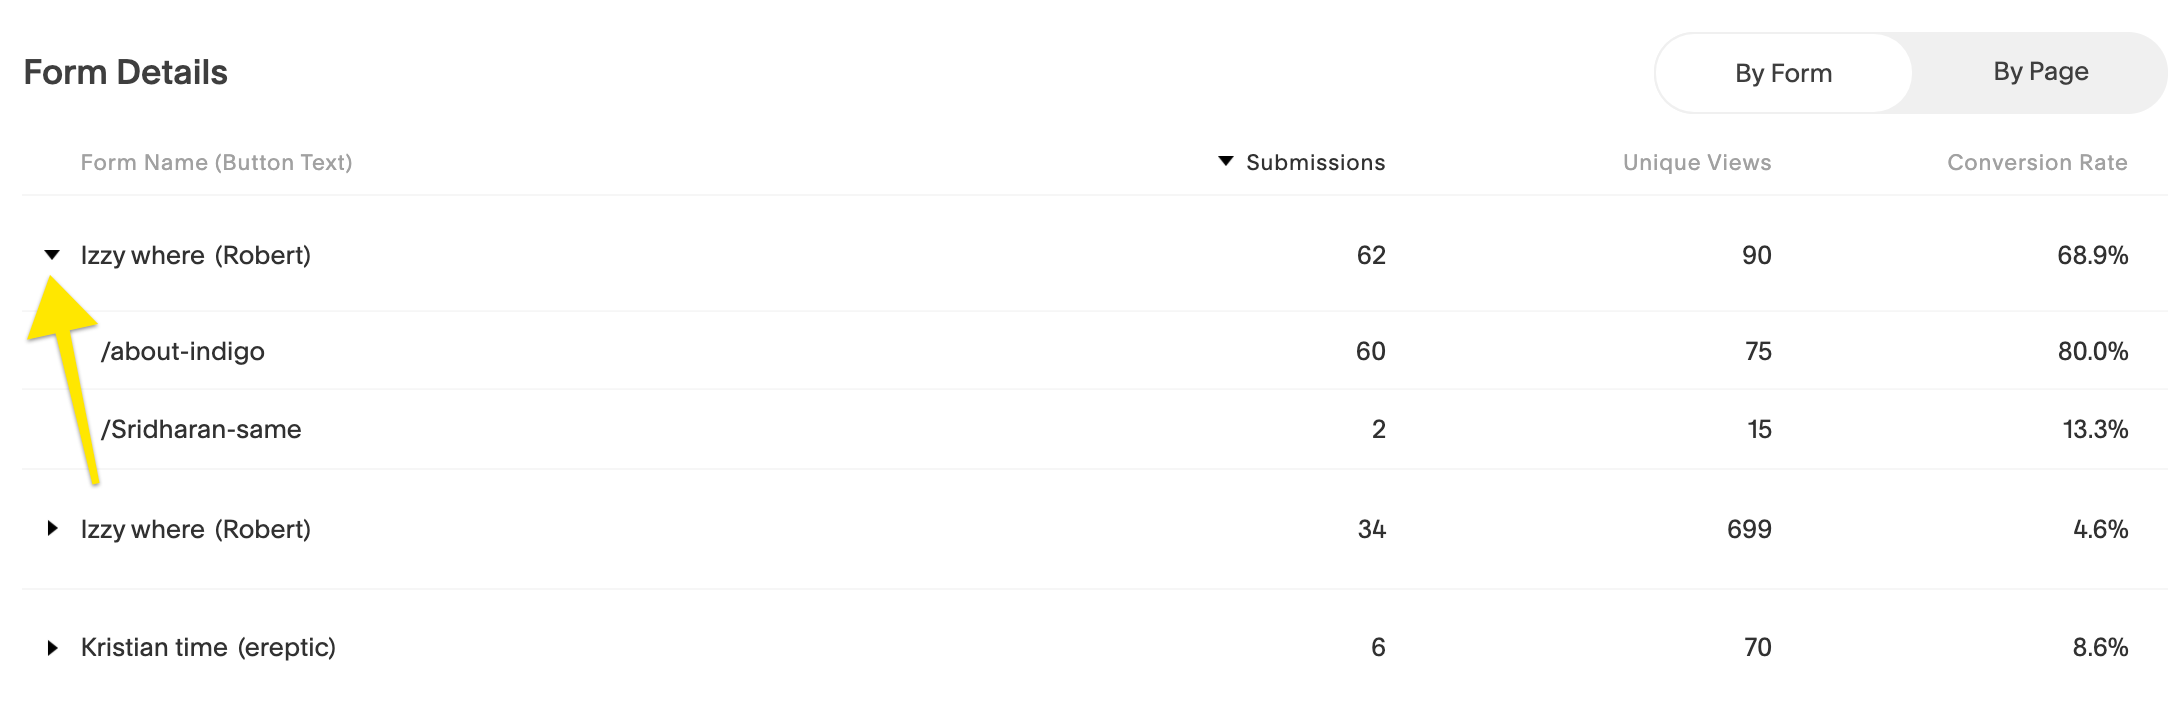
Detail table with yellow arrow
Key Features:
- Historical data tracking from September 2017
- Filter results by date range
- Compare Form Submissions and Button Clicks
- View conversion rates by form/button and by page
- Track up to 100 elements (additional grouped as "Others")
Tips to Increase Conversion:
- Optimize form length
- Minimize personal information requests
- Test different button text
- Experiment with element placement
- Use lightbox mode or promotional pop-ups
- Keep calls-to-action clear and straightforward
Mobile App Features:
- Separate cards for form and button conversions
- Filter results by KPIs
- View popular forms/buttons as graphs
- Access detailed conversion tables
- Track performance over custom timeframes
Important Notes:
- Commerce-related conversions appear in Sales Analytics
- Renamed elements update after new interactions
- Historical data remains visible after element deletion
- Promotional pop-ups show conversion for each page displayed
Related Articles

Traffic Anomaly Detection & Reporting: Monitor Website Volume Changes