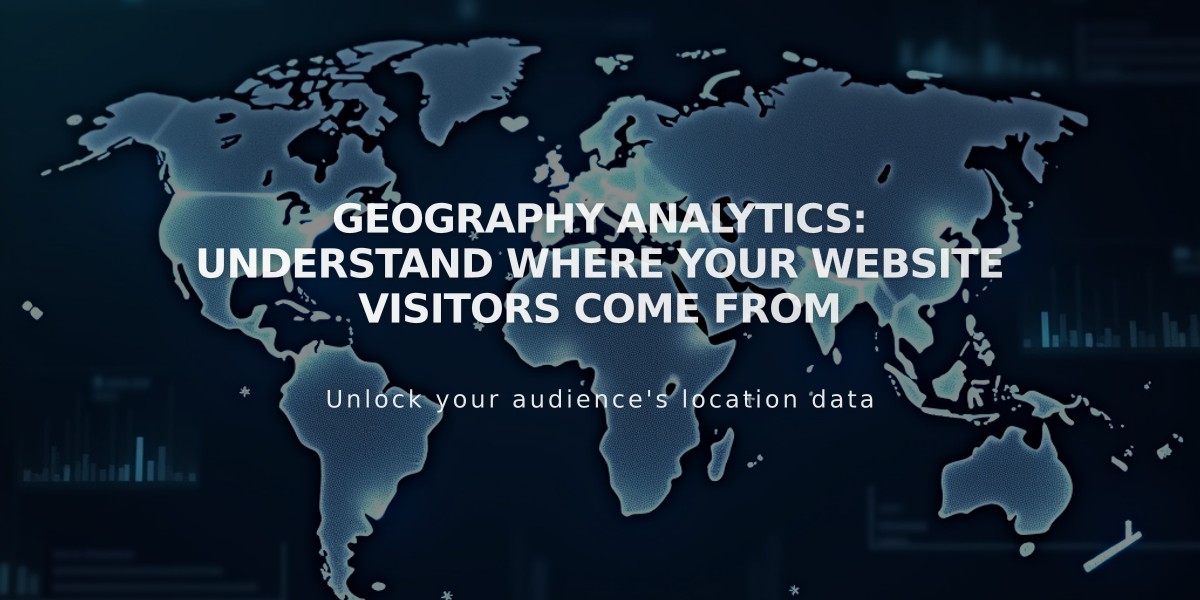
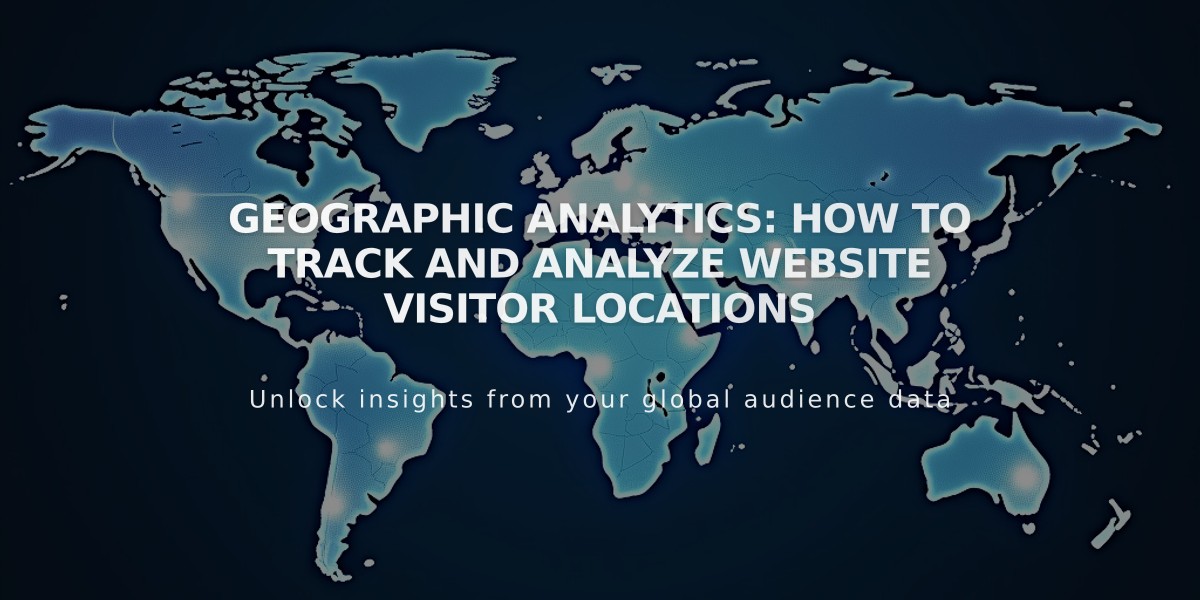
Geographic Analytics: How to Track and Analyze Website Visitor Locations
Regional Analysis provides valuable insights into your site visitors' geographical distribution. Using interactive heat maps and detailed data tables, you can track visitor locations from country down to city level.
Key Features:
- View visitor counts by location
- Analyze geographic reach
- Monitor marketing campaign effectiveness
- Track data from January 2014 onwards
Using the Map:
- Dark colors indicate higher visit volumes
- Hover over areas to see exact visitor numbers
- Click locations for detailed regional data
- Zoom in for city-level information
Table Features:
- Displays locations with 1+ visits
- Updates dynamically with map interaction
- Sort by number of visits
- Shows detailed regional statistics
Mobile App Access:
iOS Version:
- Access via Analytics > Region
- Interactive heat map with zoom capability
- Detailed regional statistics
- Tap locations for specific data
Android Version:
- Bar graph showing top country visits
- Country-wise visit breakdown
- Detailed regional statistics
- Google Maps integration
Important Notes:
- "Unknown" locations result from unidentifiable IP addresses
- Data might differ from Google Analytics due to different IP reading methods
- Results can be filtered by custom date ranges
- Only active locations (1+ visits) appear in reports
Use Regional Analysis to:
- Identify high-traffic locations
- Target marketing efforts effectively
- Track geographical business growth
- Monitor campaign performance by region
This tool helps optimize your marketing strategy by providing clear insights into your audience's geographical distribution and engagement patterns.
Related Articles

Traffic Anomaly Detection & Reporting: Monitor Website Volume Changes